13
February 2024
We are What We Measure - Getting to Grips with Volatility - Angles & Perspectives Q4 2023

Justin Floor, Head of Equities
Asset Management

John Gilchrist, Chief Investment Officer
PSG Asset Management

We are what we measure - getting to grips with volatility

At PSG Asset Management, delivering superior returns to our clients is a key motivator for us. However, striving for these great investment outcomes requires us to take on risk – in various forms. How risk is defined, measured and managed can vary substantially, and can also impact the steps the fund managers take in managing clients’ money.
The most crucial risk for most clients is not meeting their return objectives over the long term. This can occur either through being invested in a fund that underperforms the objective, experiencing some form of permanent capital loss, or through exiting a fund at the wrong time (potentially due to short-term drawdowns or weak performance) and thereby crystallising losses.
Asset managers therefore need to strive to maximise long-term performance, while ensuring that permanent capital losses are avoided and short-term performance does not disappoint investors to such an extent that they divest. However, reducing potential short-term underperformance generally has a cost, negatively impacting the likelihood of achieving the required long-term returns. Long-term risk (ensuring the fund performs) and short-term risk (reducing the likelihood of unexpected and excessive drawdowns) are frequently conflicting objectives.
When it comes to assessing risk, the investment market focuses almost exclusively on statistical volatility.
The history behind the focus on volatility
Harry Markowitz suggested ‘variance’ or ‘volatility’ as a proxy for risk within a ‘modern portfolio theory’ optimisation in his 1952 Journal of Finance ‘Portfolio Selection’ paper. In 1966 William Sharpe, one of Markowitz’s students, introduced the Sharpe Ratio in his ‘Mutual Fund Performance’ paper, directly comparing funds’ returns to the volatility of those returns. While academics in the 1950s and 1960s were proposing using volatility as a proxy for risk, market participants only started embracing this idea after the 1987 Black Monday market crash. JP Morgan’s chairman requested a daily report that would estimate the ‘maximum’ the bank could lose on its trading positions on any given day. This report, which relied on historical volatility as an input, led to the development of Value at Risk (VaR). In 1993,
JP Morgan made its methodology freely available and the use of VaR (and the view that historical volatility was an appropriate proxy for risk) spread across the finance industry.
Shortfalls and risks of using volatility as the sole measure of risk
Actual portfolio risk is incredibly difficult to assess, so it is no wonder that the finance industry has embraced one easy-to-calculate and easily understood measure, despite its numerous shortfalls and flaws. However, relying too heavily on volatility as a risk measure has significant drawbacks.
Volatility is backward looking as it is based on historical data.
Historical volatility has a correlation with market moves – when markets fall volatility rises, while in bull markets volatility tends to flatline or decline.
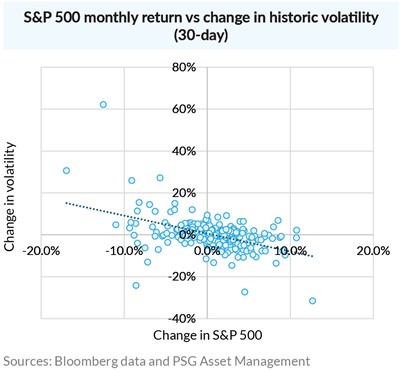
Using volatility as a risk measure implies assessing risk as higher – and hence reducing exposure – after a rise in volatility (which generally occurs following a fall in the market). Conversely it would encourage adding to exposure after a market rally (and a decline in volatility). This is completely counterintuitive. We believe that the price you pay for an asset is a critical driver, both of potential performance and of the risk of permanent capital loss. As a result, it makes more sense to us to increase exposure after a market fall, and reduce exposure after a market rally – the exact opposite of what using volatility as a risk measure would imply.
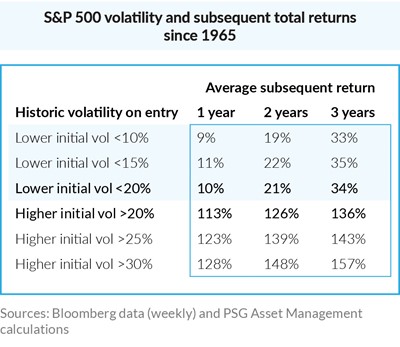
S&P total return data from 1965 supports our view, with periods of low historic volatility followed by weak returns, whereas periods of high historic volatility auger well for excellent subsequent returns.
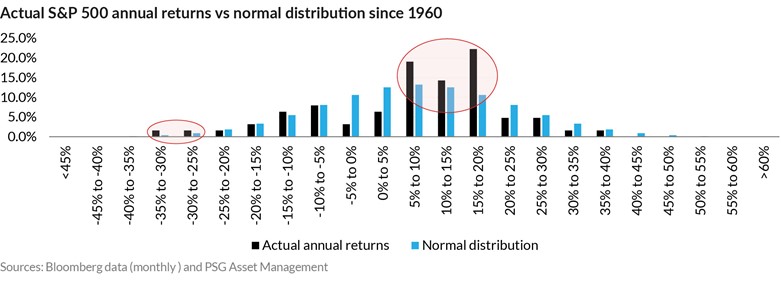
Underlying assumptions are flawed, as a normal (Gaussian) probability distribution is assumed even though markets don’t behave this way.
Using volatility as a risk measure implicitly assumes that market returns will be normally distributed around the mean on a typical bell curve. However, when comparing actual annual S&P 500 returns to a normal distribution with the same mean, it is evident that there are more actual observations around the mean and in the left tail than a normal distribution assumes. This, in turn, means that many assumptions about risk based on volatility are flawed.
 These assumptions can be even more flawed when volatility is used to assess the risk of multi-asset funds that, by design, do not display normal pay-off profiles.
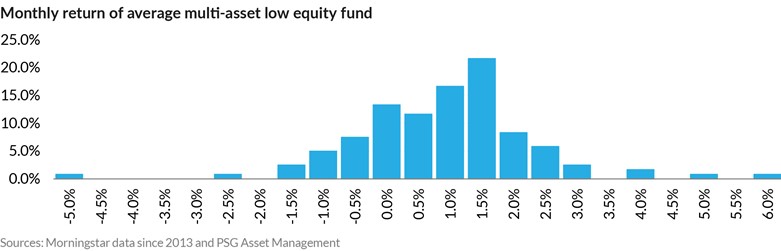
As is evident above, returns in this category are not normally distributed, showing a significant skew towards the right.
Funds and instruments that display pronounced non-linear return characteristics can have high historical volatility without necessarily exposing investors to a high probability of losses. As an example, within our multi-asset portfolios, we utilise out-the-money put options when deemed appropriate – these options introduce a non-linear payoff, with the downside risk of the distribution reduced.
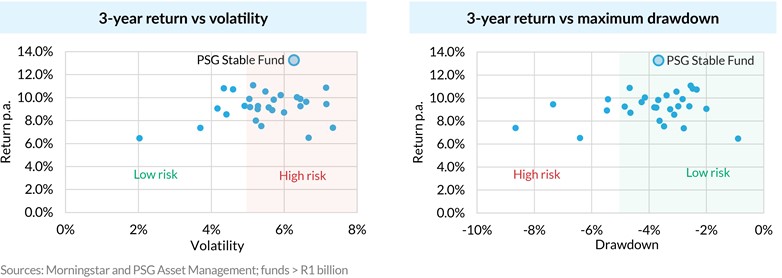
While the PSG Stable Fund would be categorised as a risky fund based on volatility (left-hand chart below), it becomes apparent that the fund can be considered relatively low risk compared to peers when assessed using drawdown (right-hand chart below).
It does not distinguish between upside volatility (which is desirable) and downside volatility.
Focusing only on volatility ignores the distinction between desirable upside volatility, and volatility associated with losses. Downside deviation is a variation of the volatility measure that
makes this distinction, measuring only the volatility associated with negative returns. Below is a comparison, for larger multi-asset high equity funds, between the normal risk vs return analysis using volatility and one using downside deviation.
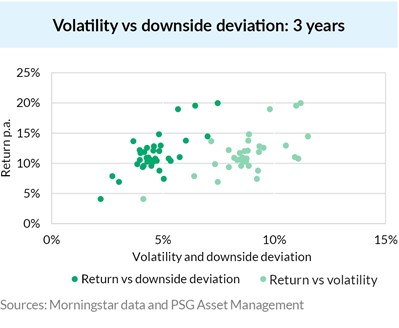
On occasion, funds seen as high risk due to elevated historical volatility are being unfairly penalised for lumpy upside performance.
It is short-term focused, often measuring volatility based on monthly returns.
Ideally, investors should focus on measures consistent with their relevant time period. While monthly volatility may be relevant for selected classes of investors, including those drawing down on a regular basis from living annuities, most investors in multi-asset or equity-centric funds have a longer-term time horizon – typically 3 to 5 years minimum – with no intention to disinvest even partially in the interim period. Measuring risk based on monthly moves creates a short-term focus with potentially negative implications for investors’ ultimate returns.
It is not necessarily a reliable predictor of the potential to lose money/incur a permanent capital loss.
We have shown under the first opening point above that periods of high volatility (often following a market correction) generally make excellent market entry points, as supported by average subsequent returns. However, are periods of high volatility actually characterised by large subsequent short-term losses (i.e. if you want to avoid losses, should you avoid volatile markets altogether)?
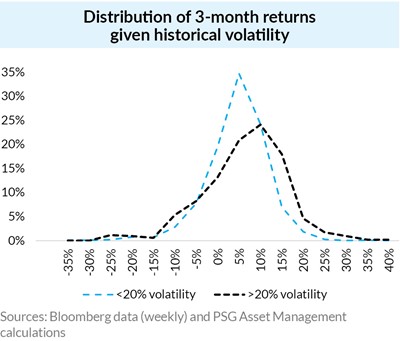
Our analysis shows that, again focusing on the S&P 500 since 1965, the difference in subsequent market losses three months later between low and high volatility regimes is immaterial, with the largest losses actually occurring when initial historical volatility was low (e.g. -37.2% for the three months ended 21 December 2008).
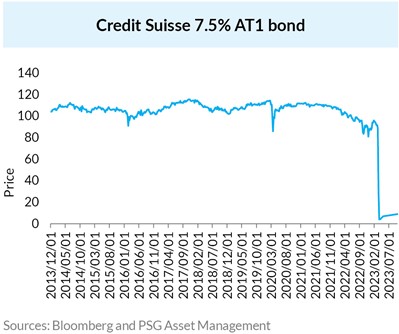
In the history of financial markets, there have been numerous examples of instruments (and some funds) that have displayed extremely low volatility, have been seen as low risk, and whose value has then precipitously dropped overnight, sometimes to zero.
Two high-profile examples:
- Credit Suisse’s Additional Tier 1 (AT1) bonds which were written off by the Swiss Financial Market Supervisory Authority regulator as part of the forced rescue merger with UBS in March 2023, resulting in losses of over US$17 billion for investors.
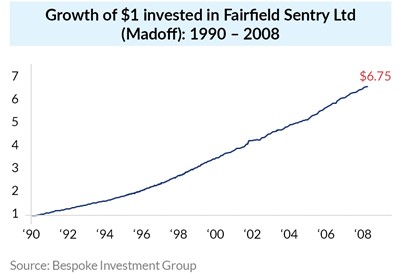
- Bernie Madoff’s ponzi scheme: While Madoff’s returns were not exceptional (roughly 10% p.a.), clients were attracted by the consistency of the returns and the resultant low volatility. Ultimately, of the US$65 billion of purported client assets (based on fictitious client statements) less than US$15 billion in cash deposits were distributed to investors (a 77% loss).
Fund volatility can be reduced artificially.
Private capital – both debt and equity – is generally marketed as being higher return and lower risk.
While there is evidence of outperformance during the early days of private equity, more recent returns are consistent with public market returns if you normalise for the high levels of gearing used. However, even at lower prospective returns, private capital remains attractive for investors because of the opaque mark-to-market process, and the resultant artificially low volatility of returns.
While public funds are marked to market daily, numerous asset prices either don’t mark-to-market because of very low liquidity, or are structured in such a way that they are accounted for on an accrual basis. We previously wrote in the Q1 2023 edition of Angles & Perspectives about South African credit markets that freeze up during periods of stress (most recently during March/April 2020) and the extensive use of structured products within income funds. We believe an excessive focus on volatility contributes to demand for credit investments at unattractive spreads, reducing prospective returns and increasing the risk of permanent capital loss, and also drives greater investment in illiquid bespoke products.
The extensive use of instruments that don’t mark-to-market regularly within income and similar funds means volatility as a measure of risk is a potentially misleading indicator to use in this segment of the market.
What are the implications of the shortfalls noted earlier?
While historical volatility as a proxy for risk is clearly flawed, it is, as noted earlier, relatively simple and objective and is likely to continue to be a key part of any investor’s due diligence process and ongoing monitoring of a fund. Other more rigorous quantitative analyses are often too complex and esoteric, and are unlikely to be embraced by the broader financial community. However, we believe that it is crucial that risk be considered holistically, with both a quantitative and a qualitative assessment. Key quantitative measures include:
- Fund category
- Factor analyses
- Downside deviation
- Drawdown analyses
- Portfolio stress-tests
- Analysis (volatility, downside deviation, drawdown, etc.) over a time horizon more appropriate for the
Leading multi-managers, institutional investors, discretionary fund managers and sophisticated advisers all conduct extensive due diligence processes on investment managers, gaining insights into how they construct portfolios, and how fund managers think about and manage risk across the fund range. We believe this due diligence process is crucial to ensure that risk is assessed properly, and that the risks of relying solely on one flawed measure are mitigated. In addition, while an individual fund may appear risky on a stand-alone basis, each fund needs to be assessed in conjunction with other funds it may be combined with in a solution. This is particularly relevant for funds managed on a similar basis to those of PSG Asset Management, given we do not construct our funds using benchmarks or strategic asset allocations, and hence can bring significant diversification benefits.
Over the course of 2024, we will delve further into risk, and how we think about and manage risk within our portfolios.
References:
- Against the Gods – the remarkable story of risk: Peter L. Bernstein
- Volatility: a fundamentally flawed measure of portfolio risk: Geoff Dover
- CFA Institute Research Foundation – Managing Material Risk: Richard Bookstaber and Dhruv Sharma
- Volatility: a brief history of markets: Bocconi Students Capital Markets

Recommended news
Welcome to the latest edition of the Angles & Perspectives
In this edition, Head of Research Kevin Cousins and Co-CIO Greg Hopkins explain why culture is so important to us at PSG Asset Management, and how it enables us to achieve excellent investment outcomes for our clients. Then, we turn our attention to the many-faceted nature of risk. Head of Equities Justin Floor and Co-CIO John Gilchrist unpack why a more nuanced view of risk can facilitate more robust decision-making. Finally, Head of Equities Justin Floor and Fund Manager Dirk Jooste get to grips with the thorny issues of the risk of investing in SA equities, and weighing them against the opportunities we see ahead.
Read moreIntroduction - Angles & Perspectives Q4 2023
Read moreFostering a Culture of Teamwork and Learning - Angles & Perspectives Q4 2023
Read moreInvesting in SA-Exposed Securities: Finding the Opportunity Amidst the Danger - Angles & Perspectives Q4 2023
Read moreStay Informed
Sign up for our newsletters and receive information on finance.
