

Investment Strategy
The S&P 500’s earnings boom: scepticism is warranted

A record share of this year’s earnings growth is coming from paper gains on artificial intelligence (AI) stakes and AI-capex related earnings boosts, not from selling more goods and services.
Earnings drive markets – eventually
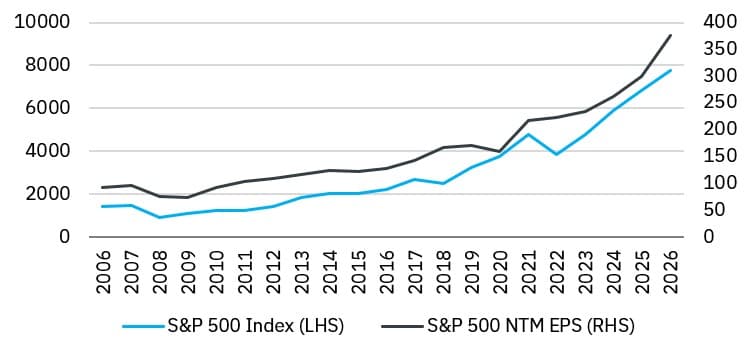
Over meaningfully long periods, earnings drive equity market returns. The 20-year relationship between the S&P500 Index and the S&P 500 next-twelve-month (NTM) earnings per share (EPS) consensus estimate illustrates this point extremely well (see below). Changes in valuation multiples can impact index performance over the shorter term, but from a longer-term perspective, this is noise. Since 1871, based on Shiller/S&P data, the components of total US market return can be summarised as follows: EPS growth (4.3%) + Dividend yield (4.5%) + Valuation Multiple change (0.6%) ≈ Total return p.a. (9.4%)
The Global Financial Crisis (GFC), Covid-19 crash and 2022 rate-hiking cycle all produced periods where price and forward earnings diverged, but in each case the gap closed soon thereafter. Either the index fell to reflect weaker earnings, or earnings caught up to a market that had already priced in the recovery.
S&P 500 Index and S&P 500 NTM EPS
A dramatic earnings acceleration in 2026
We have seen a huge surge in forward earnings estimates in 2026. This has supported positive market sentiment and underpinned an impressive performance by the S&P500 Index year to date, despite the uncertainty associated with the Iran war and the related economic fall-out. The S&P 500 Index’s bottom-up consensus EPS estimate for calendar year 2026 has climbed to roughly US$362 (up 30.7% from 2025), and 2027 estimates are approaching US$401 (a further 10.8% increase). The earnings increases have moved higher exceptionally quickly. According to FactSet data, expected year-on-year earnings growth for Q2 2026 moved from 23.2% at the end of June, to 37.9% by 24 July (with barely a quarter of companies having reported), to more than 50% in early August. This has been the fastest pace for earnings increases since the post-Covid rebound of 2021.
Markets have taken comfort from this earnings growth: the S&P 500 Index closed at a fresh record above 7 750 in the first week of August, and a number of global banks have lifted year-end targets to 8 000 or above. While the headline earnings increases have been impressive, when one delves into the details, the quality and sustainability of these earnings come into question. But where has the growth come from?
The growing importance of ‘other income’
A significant portion of the recent increase in earnings is attributable to ‘other income’ – primarily mark-to-market revaluations of equity holdings in AI companies. Alphabet’s second-quarter result offers the clearest illustration of this. The company reported net income of US$112.1 billion, up 298% year on year. This included US$98 billion of ‘other income’, which was comprised almost entirely of unrealised gains on its equity stakes in SpaceX and Anthropic.
Alphabet was not alone: Amazon booked a similar non-operating gain (roughly US$53 billion) in the same quarter.
If we look at abnormal items (which includes other income, restructuring costs, impairments, etc.), in aggregate across the S&P 500 over time, the material impact of these revaluations is evident, with a US$193 billion gain in Q2 2026 (15.8% of pre-tax income) versus an average -US$47 billion quarterly expense (-7.8% of average pretax income) over the last five years – a swing of more than 20%.
S&P 500 abnormal items (US$ billion)
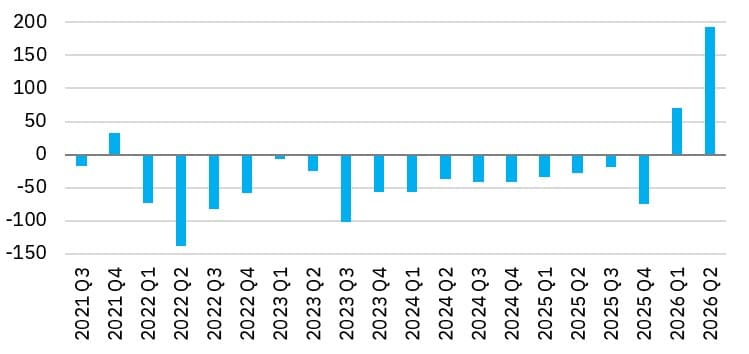
Put another way, almost half of the index’s headline earnings growth can be traced back to one volatile accounting line at a handful of companies. The scale of the mark-to-market impact reflects how fast private AI valuations have moved. Anthropic’s private valuation roughly tripled in the quarter, from about US$350 billion to US$965 billion. SpaceX listed in June at a US$1.77 trillion valuation. It is notable that both companies are also large customers of their own investors: Anthropic has committed to tens of billions of dollars of Google Cloud and Microsoft Azure spending, funded in part by the same capital its equity backers are now marking up on their own income statements. Bloomberg and others have documented this ‘circular’ web of deals across Nvidia, Microsoft, OpenAI and Anthropic in detail.
Mark-to-market gains on illiquid, privately-held stakes are highly volatile. SpaceX is a powerful example: having listed at US$1.77 trillion in June, it briefly traded above US$2.9 trillion intraday shortly thereafter, before falling to below US$1.4 trillion by early August – a swing of over US$1.5 trillion in six weeks. If Alphabet’s next mark reflects SpaceX’s current level rather than its second-quarter peak, a meaningful reversal is a real possibility, rather than a tail risk. To include these one-off items in the aggregate index earnings (and the earnings growth rates) used to justify an ever-increasing index price level, appears to be a mistake that analysts are not making at the individual stock level.
The earnings boost from AI-related capex spend
The eye-watering amounts the hyperscalers (Amazon, Microsoft, Google, Meta and Oracle) are currently spending (and are projected to spend in the future) on AI infrastructure, are making headlines and attracting the market’s attention. What has received less attention, is the earnings distorting impact of this expenditure, primarily due to the fact that this spend is of a capital nature. The distortion of S&P 500 Index earnings is best illustrated by a simple example of spend on semi-conductor chips. When a hyperscaler buys Nvidia chips, Nvidia recognises the revenue immediately, at gross margins approaching 75%. The buyer, by contrast, records that same spending as capital expenditure and depreciates it over an assumed useful life (six years on average). The result: for every dollar of AI semi-conductor spend, roughly 75 cents of profit is recognised by the seller in year one, while the buyer expenses only 17 cents, with the rest of the cost deferred to future years. Every dollar spent boosts overall index-level earnings before tax immediately. Had that dollar instead been spent on operating expenditure (opex) ‒ for example rented cloud capacity rather than hardware bought ‒ the seller’s revenue and the buyer’s expense would be recognised in the same period, largely cancelling out at the index level. We are not disputing the accounting approach, nor claiming that the capex spend has not created assets that could generate substantial returns for a number of years. We are just noting the material front-loading effect on earnings, and the creation of future earnings headwinds. Across the hyperscalers, we estimate the breakdown of capex in H1 2026, based on company disclosures, to be as follows:

Two further wrinkles stretch the expense lag noted above further. First, AI infrastructure is increasingly funded through off-balance sheet special purpose vehicles (like Meta’s US$27 billion Hyperion joint venture with Blue Owl Capital). This keeps the debt, asset and its depreciation outside the hyperscalers’ accounts. Secondly, an asset under construction is not depreciated at all until it is ‘placed in service’. Disclosed construction-in-progress balances across AI infrastructure names already exceed US$200 billion. Between these two aspects, a growing slice of AI capex sits off the income statement, or has not yet started depreciating ‒ obscuring the earnings drag still to come.
The depreciation bill has barely started
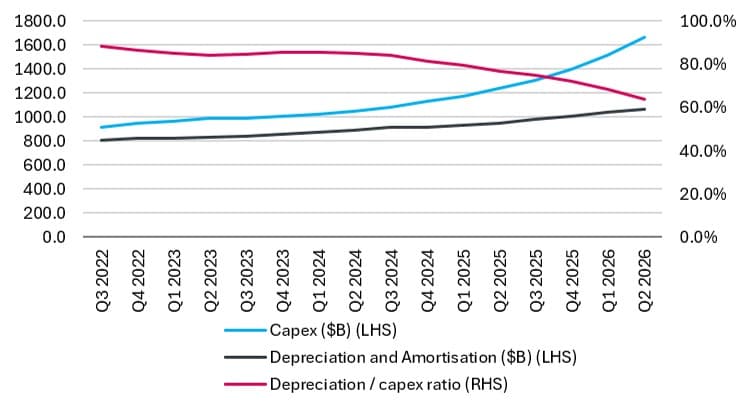
Our own analysis of aggregate S&P 500 capital expenditure and depreciation, using Bloomberg data back to 2006, shows the index’s depreciation/capex ratio has averaged 0.85x over 20 years, reflecting a healthy growing asset base in real terms. However, as capex has ramped up over the last few years, driven by the AI infrastructure roll-out, the depreciation/capex ratio has dropped well below this average, reaching 56% in Q2 2026 on a quarterly basis. This is lower than the levels reached in the pre-GFC energy capex boom. Over the last five years, cumulative S&P 500 capex has been US$5.8 trillion, while depreciation over this period has totalled US$4.5 trillion. In other words, if capex were to stop tomorrow, nearly US$1.3 trillion of depreciation expense would still have to come through the S&P 500 company income statements. Alternatively, normalising the depreciation charge relative to capex over this 5-year period to the 0.85x average, would imply an additional US$400 billion in depreciation expenses.
Rolling 12-month capex spend vs. depreciation (US$ billion)
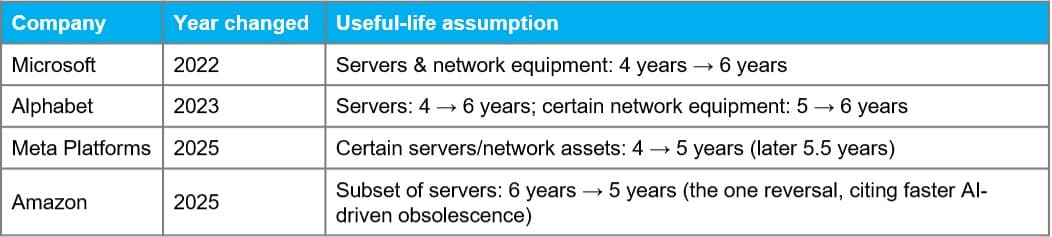
The delay in depreciation expense can be partially explained by changes to the useful life of assets. Michael Burry argued in November 2025 that hyperscalers were “understating depreciation by extending the useful life of assets,” estimating that Meta, Amazon, Microsoft, Alphabet and Oracle would collectively understate depreciation by around US$176 billion between 2026 and 2028. Every major hyperscaler except Amazon has extended assumed useful lives over the past four years, just as AI chip product cycles have shortened.
The depreciation still to be expensed creates a material headwind to future earnings growth. US$1.3 trillion is 38% of the US$3.3 trillion pretax income generated by the S&P500 companies over the 12 months ending Q2 2026 (after adjusting for other income). If this normalises over five years, it represents a 7% headwind to annual S&P500 EPS growth.
What this means for the multiple you are actually paying
Put the two effects together ‒ the non-operating investment gains and front-loaded boost to earnings from AI infrastructure spend as outlined above ‒ and a very different earnings picture emerges. Our own high-level normalisation suggests sustainable S&P 500 earnings are running 25% to 30% below the reported and consensus figures. This adjustment would bring earnings in line with the longer-term earnings trend line. This also implies that, rather than trading on a 20x forward price-earnings multiple, the S&P 500 Index is actually trading closer to 26x to 29x on a more conservative earnings base ‒ rich territory that has generally preceded periods of anaemic or disappointing index performance.
Buyer beware
AI is materially changing our world, and its use cases and implications will continue to evolve in ways we can’t anticipate right now. There is genuine, durable revenue growth already being delivered: Google Cloud revenue grew 82% with its backlog up US$52 billion to US$514 billion, while AWS accelerated to 36.7% growth, its fastest pace in 18 quarters. However, a meaningful share of the earnings being used to justify today’s index-level valuation is not sustainable. These earnings are flattered by a mark-to-market gain that can, and has, reversed by over a trillion dollars in a matter of weeks, and by front-loading the earnings impact of AI capex-related spend due to deferred depreciation charges. Reasonable people can debate the exact size of the adjustment, but we do not think anyone can credibly argue it is zero. Until the depreciation bill starts to bite, and until this year’s investment gains prove durable rather than a snapshot of a frothy few months for private AI valuations, we would treat headline S&P 500 earnings ‒ and, as a result, the multiple paid for those earnings ‒ with real scepticism. While valuations are a poor short-term timing tool, they are a reliable indicator of long-term subsequent returns. Given the ‘true’ current rating of the S&P 500 Index, buying it now is likely to deliver very low long-term returns.
This article first appeared in Glacier's Funds on Friday publication.
Share





