Fraudulent Telegram and WhatsApp groups
Please beware of fraudulent Telegram and WhatsApp groups impersonating PSG Financial Services, our divisions and our advisers. Be cautious, verify links and contact your adviser or Client Services if you have any queries or concerns.
31
March 2021
What’s all the fuss about the bond market?

Tunin Roy
Wealth Adviser
The story of the last few weeks in finance has been bond market volatility and its impact on equity markets. Here I aim to provide some detail on the basics of bonds, yields, and the yield curve to help you make sense of it all... First, a few quick definitions.

“ Investors are worried about rising bond yields – but why? ”
The story of the last few weeks in finance has been bond market volatility and its impact on equity markets.
Here I aim to provide some detail on the basics of bonds, yields, and the yield curve to help you make sense of it all...
First, a few quick definitions.
A bond is essentially an IOU slip given by a borrower (usually a company or government) to an investor. The borrower is said to "issue” a bond, putting it up for sale. Investors “buy” the bond, providing the loan. The bond has a "maturity date" on which the borrower must return the remaining principal balance to the investor.
At issue, the bond is given a "coupon rate" - the interest rate the borrower has to pay the investor as compensation for taking the risk of loaning money. The riskier the loan, or the less likely the chance of coupon payments being honoured or full repayment of the loan amount (or principal) being paid at the maturity date, the higher the coupon that investors will demand.
Typically bonds are issued at a price of 100 and are redeemed at maturity for 100. Between issue and the maturity of the bond, they trade in the secondary market and bond prices can vary around 100 depending on factors such as the changing creditworthiness of the issuer or expectations of changes in interest rates (for example if interest on cash increases, the fixed coupon on a bond becomes less attractive).
A bond "yield" is the expected return the investor will earn by owning the bond. It is calculated by relating the price of the bond on purchase to the coupon. In very basic form, if you buy a bond at 95.24 with 1 year until maturity and a 5% coupon, you earn 5 % from the coupon and 5% from the capital improvement in price from 95.24 to 100 at maturity – so the yield is 10%.
A bond yield will increase with higher risk from:
(1) Risk of default
(2) Opportunity cost vs. holding something else (interest rates)
(3) Expected future inflation
Bond yields are inversely correlated to bond prices. As bond prices rise (from increased investor demand), yields go down. As bond prices fall (from decreased investor demand), yields go up.
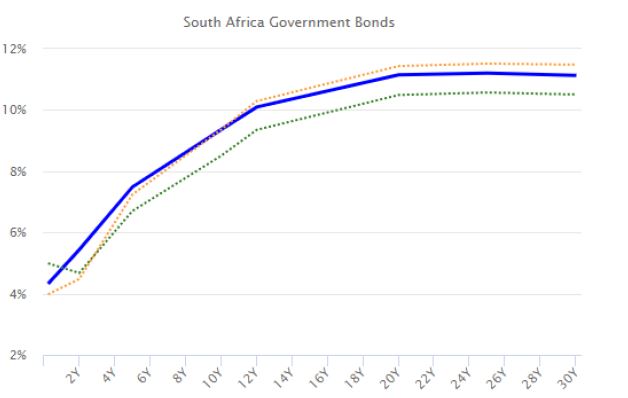
A yield curve is just a line that plots the yields of bonds with the same credit quality but different maturity dates. The South African yield curve (for government bonds) is shown below:
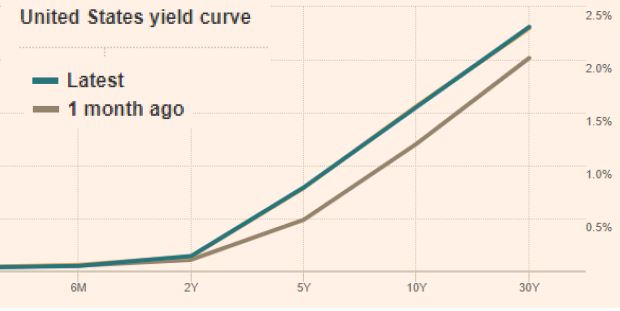
The US Treasury yield curve is the most commonly discussed yield curve. As the name implies, this is a line that plots the yields of US Treasury bonds (bonds issued by the US government) with maturity dates from 1 month to 30 years.
But why is it important?
The shape of (and changes in) the US Treasury yield curve can provide important information about investor sentiment in the economy.
So now let's come back to the present.
The Treasury yield curve has been steepening dramatically in 2021.
The vaccine rollout is going well, the US looks set to recover and massive stimulus packages have been approved by the US Congress. The "return to normal" seems near in the developed world. Expectations are forming that inflation may rise in response to unprecedented money supply growth and pent-up demand following global lockdowns. Indeed, many commodity prices, including oil, agricultural commodities, industrial metals and building materials have risen substantially.
Investors are selling longer-term bonds because, if inflation is going to pick up and therefore interest rates may rise in future to contain it, bond prices are likely to fall. This sends yields much higher albeit from record low starting levels. The yield on the US 10-year Treasury bond has risen from 0.52% in August 2020 to almost 1.6% today. That is more than a threefold rise.
But why does this matter? Remember that bond yields are an indicator of the cost of borrowing money. When the Fed lowers rates (as in 2020 in response to COVID-19), it stimulates the economy, because companies and people can borrow at low rates and put that money to productive uses, investing it in the economy.
Many companies - especially the tech megacaps who were already the "winners" of the pandemic - benefitted tremendously from exceptionally low interest rates and near-zero risk-free rates (usually seen as being a US government bond yield).
When the equity investor sees the bond investor selling longer bonds, there are a few implications:
- The cost of borrowing money is increasing - it's now more expensive to borrow money and drive growth.
- Higher risk-free rates mean applying higher discount rates when valuing future cash flows. If you can get higher rates or yield on US government bond yields, you don’t need to take on as much risk to earn returns elsewhere, like in equities.
As a result of this dynamic, when bond yields spiked in February and early March, the Nasdaq experienced its own sharp selloff. Nothing had fundamentally changed about the companies themselves, but the perception of the macro situation did. This impacted their value.
Everyone looked to Fed Chair Jerome Powell for assurance that they would take action to lower rates, but he was surprisingly silent. This created worries among investors about the prospects for the equities that had benefitted the most from low rates and low bond yields, especially the big tech companies.
Most investors with cash on hand are choosing between holding cash (exposing yourself to inflation), buying bonds (at historically low yields), or buying equities (at historically high valuations).
When investors compare potential equity returns against near zero risk-free rates, they may be inclined to look further out the risk spectrum for returns. When you buy something (a stock, a bond, a house) you are implicitly or explicitly deciding to sign up for the return that it will give you vs the risk free rate which you could otherwise get.
If you sell an “expensive” stock today, what do you do? Buy bonds? But they still do not provide you with an attractive return as, although yields have risen, they are still only at 1.6% over 10 years. So for many it’s better to own a stock compared to a bond or especially compared to cash, if inflation is going to rise.
Although yields have increased they are still historically low
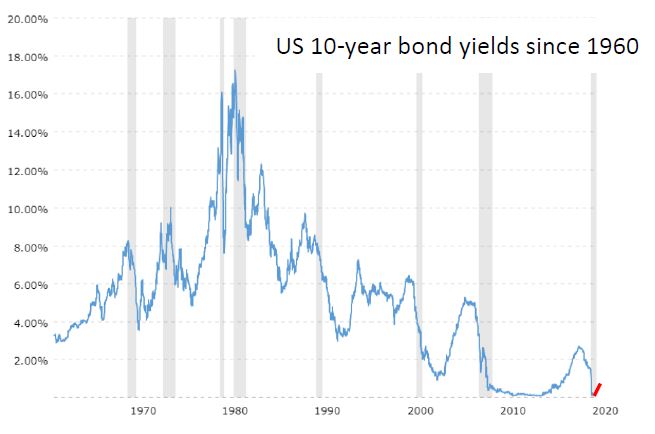
US 10-year bond yields since 1960
With rates bouncing off record lows, people remain open to looking further in the future for a company to deliver cashflows allowing people to put high values on stocks that are likely to only deliver significant profits in 5-6 years, for example Tesla or Netflix. However, if rates continue to rise, that may change and investors may want to see a return in 2-3 years or even sooner instead.
In summary, the recent increase in US yields suggests a number of things for global investments:
- Maintain your equity weighting in line with your risk profile
- Diversify away from big tech – this includes passive investments with a big weighting to tech – into cyclicals, banks, commodities and miners, and stocks with solid cashflows
- Reduce government bond holdings (as when yields rise, prices fall)
Please get in touch if you would like to discuss further.
+27 (0)79 551 5988 | tunin.roy@psg.co.za
PSG Claremont | Tel: +27 (79) 551 5988 | tunin.roy@psg.co.za | psg.co.za
The opinions expressed in this document are the opinions of the writer and not necessarily those of PSG. The information in this document is provided as general information. It does not constitute financial, tax, legal or investment advice and the PSG Konsult Group of Companies does not guarantee its suitability or potential value. Since individual needs and risk profiles differ, we suggest you consult your qualified financial adviser, if needed. PSG Wealth Financial Planning (Pty) Ltd is an authorised financial services provider. FSP 728.
Stay Informed
Sign up for our newsletters and receive information on finance.
